Test D: Sinking
temperature perturbation in domain center
- Domain and execution:
- 33x33x16 grid - runs quickly for interactive testing
- (note odd dimension
for nx,ny; initial bubble at exact X-Y center)
- ∆x=∆y=∆z = 500
meters
- ∆t = 1.0
seconds
- Physics:
- All processes retained and active.
- Sound speed Cs=100 m/s.
- Non-monotonic
piecewise linear advection.
- Diffusion coefficients = 50 (momentum), 5 (temperature).
- Initial
condition: same
as Test A
- Theta: 1 thermal: -20˚, center (8250,8250,4250) meters (grid point 17,17,9); radius = 4000m in each direction x,y,z
- U,V,W: are all
initially
zero - no
perturbations on U or V
- Boundary conditions:
- Usual
(symmetric X, periodic Y, 0-gradient Z)
Test D1: Center sinking bubble
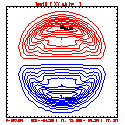
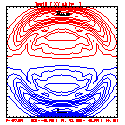
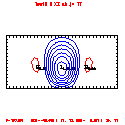
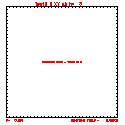
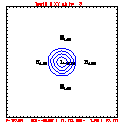
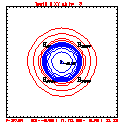
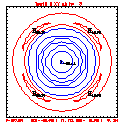
- I have used the "www" option from plot3d on test D; the results are online here.
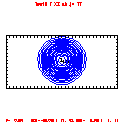
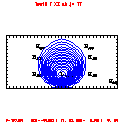
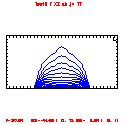
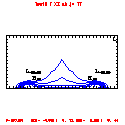
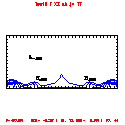
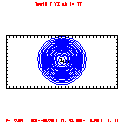
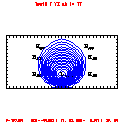
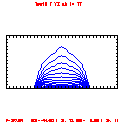
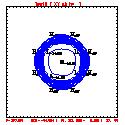
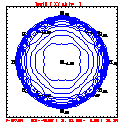
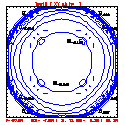
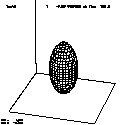
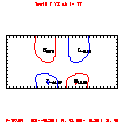
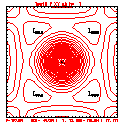
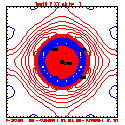
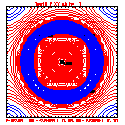
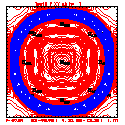
- Cold bubble placed at center at time T=0; run for 400 seconds.
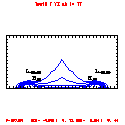
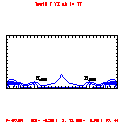
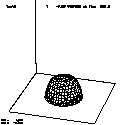
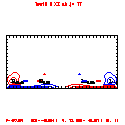
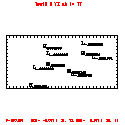
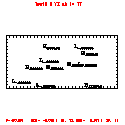
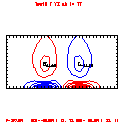
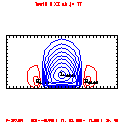
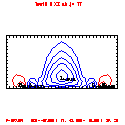
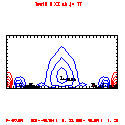
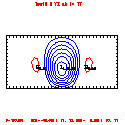
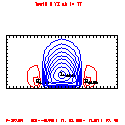
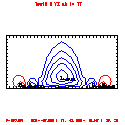
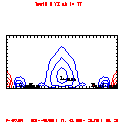
- The negatively buoyant theta perturbation descends
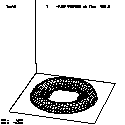
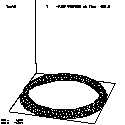
to the domain bottom and spreads symmetrically
outwards, reaching domain boundaries. For the X
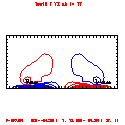
symmetry boundaries, the density current then
'splashes' upwards and climbs the 'wall' since no flow
through the boundary is possible. For Y, the
density current moving towards -Y will hit the
boundary at the same time the current moving to +Y
reaches that boundary. Due to periodic BCs in Y,
the two collide there, with behavior like that seen at
the X boundaries.
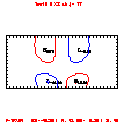
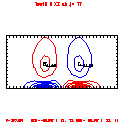
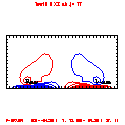
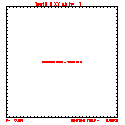
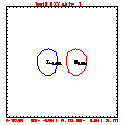
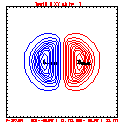
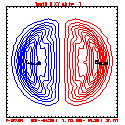
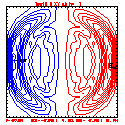
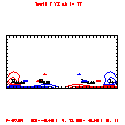
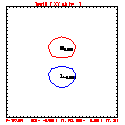
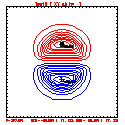
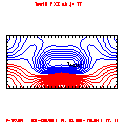
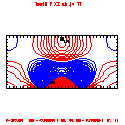
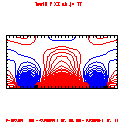
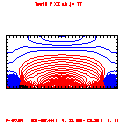
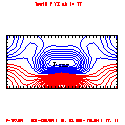
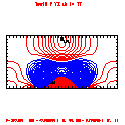
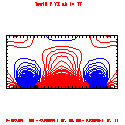
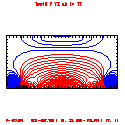
- All plots made with plot3d program; contour intervals are 5 m/s (U,V,W), 20 hPa (P')
- All cross sections are through the center: X-Z at
j=(nx-1)/2, or Y-Z at i=(ny-1)/2
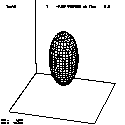
- 3-D plots use plot3d default "eye", looking toward origin from location in +X, +Y, +Z (so +X is out of page towards you)
- The 3-D plot of theta used a smaller (T' = -5K
instead of -10K) isosurface than in earlier tests - to
show the T' evolution later in the run.
- Note symmetry
in the solution; the following should look
nearly identical, until perhaps the density current
reaches the
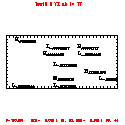
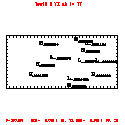
X, Y boundaries with their different BCs: - X-Z and Y-Z plots of U should look alike, and be nearly identical to X-Z and Y-Z plots of V
- X-Z and Y-Z plots of T should look alike
- X-Z and Y-Z plots of W should look alike
- X-Z and Y-Z plots of P should look nearly alike -
small differences are expected
- X-Y plots should be nearly symmetric until
reaching the boundaries
- Text output from running code may be found
here.
- A slightly longer run (to T=500) was used to prepare animations of 3-D T': GIF, Quicktime
| Test D1 | T=0 | T=100 | T=200 | T=300 | T=400 |
|---|---|---|---|---|---|
| T X-Z |
 |
 |
 |
 |
 |
| T Y-Z |
 |
 |
 |
 |
 |
| T X-Y k=1 |
 |
 |
 |
 |
 |
| T 3-D |
 |
 |
 |
 |
 |
| U X-Z |
 |
 |
 |
 |
 |
| U Y-Z |
 |
 |
 |
 |
 |
| U X-Y k=1 |
 |
 |
 |
 |
 |
| V X-Z |
 |
 |
 |
 |
 |
| V Y-Z |
 |
 |
 |
 |
 |
| V X-Y k=1 |
 |
 |
 |
 |
 |
| W X-Z |
 |
 |
 |
 |
 |
| W Y-Z |
 |
 |
 |
 |
 |
| W X-Y k=3 |
 |
 |
 |
 |
 |
| P X-Z |
 |
 |
 |
 |
 |
| P Y-Z |
 |
 |
 |
 |
 |
| P X-Y k=1 |
 |
 |
 |
 |
 |
Test D2:
Center sinking bubble but without U,V,W [nonlinear] advection
running
- The test case is the same above, except...
- I disabled the U/V/W advection (of U,V,W: the nonlinear advection terms)
- The results are similar but give you a test to see if your nonlinear advection terms are working.
- I used the "www" option from plot3d to plot
the fields; the results are
online here.
Test D3/u:
Center sinking bubble with u nonlinear advection
(without v,w)
- The test
case is the same as case TestD above, except... no
nonlinear advection of v or w (only u).
- I used the "www" option from plot3d to plot the fields; the results are online here.
Test D3/v:
Center sinking bubble with v nonlinear advection
(without u,w)
- The test
case is the same as case TestD above, except... no
nonlinear advection of u or w (only v).
- I used the "www" option from plot3d to plot the fields; the results are online here.
Test D3/w:
Center sinking bubble with w nonlinear advection
(without u,v)
- The test
case is the same as case TestD above, except... no
nonlinear advection of u or v (only w).
- I used the "www" option from plot3d to plot the fields; the results are online here.