This test is designed to
help you evaluate your temperature advection code.
I recommend you start with test A2 -- Y-advection of theta.
Test A: (Linear)
advection
If you are having difficulty with your advection (of momentum, or theta), let me know - we can probably construct one of the above tests to check your code, if you can't find an obvious problem.
I recommend you start with test A2 -- Y-advection of theta.
Test A: (Linear)
advection
- Domain and execution:
- 33x33x16 grid - runs quickly for interactive testing
- (note odd dimension
for nx,ny; bubble at exact X-Y center)
- ∆x=∆y=∆z = 500
meters
- ∆t = 1.0
seconds
- Physics:
- Advection of theta (only); piecewise linear (no monotonicity constraint on slopes)
- Strang
splitting is now used in calling the x-, y-, and
z- advection operators when advecting theta.
- Tests below were implemented by: setting U,V,W to constants (see below) every time step just after calls to my BC routine and before Advect. Calls to diffusion and PGF/Buoyancy routines were commented out.
- I left calls to
advection of U/V/W still in effect, but U,V,W were
replaced every time step, so it did not matter.
- Initial condition:
- Theta: 1 thermal: -20˚, center (8250,8250,4250) meters (Fortran grid point 17,17,9); radius = 4000m in each direction x,y,z
- U,V,W: all are
initially zero - no perturbations - other than
changes mentioned below.
- Boundary conditions:
- BC routine is not changed (symmetric X, periodic Y, 0-gradient Z)
- For this to
work, your usual BCs for U/V/W are overridden by
changing your main program:
>>> set U, V, or W to a constant value every time step, just after BC is called. Use the values listed below.
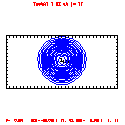
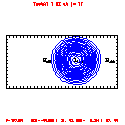
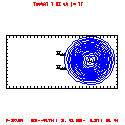
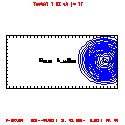
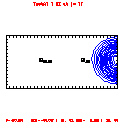
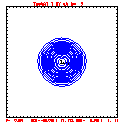
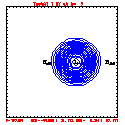
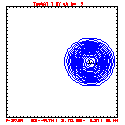
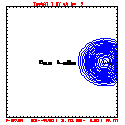
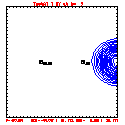
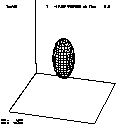
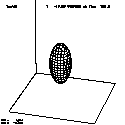
Test A1: x-advection of theta
- Bubble placed at center at time T=0
- U = 20 m/s (constant); V=0, W=0
- This test requires "defeating"
your U BCs by e.g. re-setting U2=20 everywhere after
you call your BC routine ...
... to "override" where your BC routine flips the U values on the left and right boundary edges as it should.
- Bubble moves 8000m from X center [ 8250 m = ∆x/2 + (nx-1)/2•∆x ] to right domain edge [ 16250 m = ∆x/2 + (nx-1)•∆x ]
- At 20 meters per second, the bubble moves 8000m in 400 seconds. Run code for 400s, plotting every 100s
- All plots made with plot3d program; theta contour plots
below use contour interval of 1˚
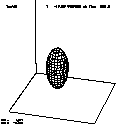
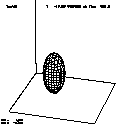
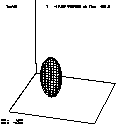
- 3-D plots use plotp6 default "eye", looking toward
origin from location in +X, +Y, +Z (so +X is out of
page towards you)
- Text output from running code may be found here.
Animation of 3D view available as an animated GIF.
| Test A1 | T=0 | T=100 | T=200 | T=300 | T=400 |
|---|---|---|---|---|---|
| X-Z j=17 |
 |
 |
 |
 |
 |
| X-Y k=9 |
 |
 |
 |
 |
 |
| 3-D |
 |
 |
 |
 |
 |
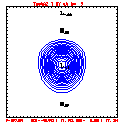
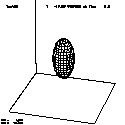
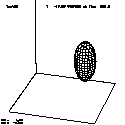
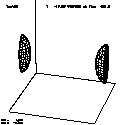
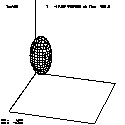
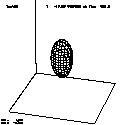
Test A2: y-advection of theta
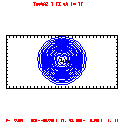
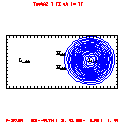
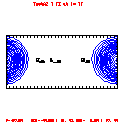
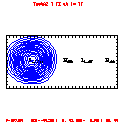
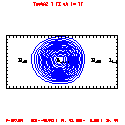
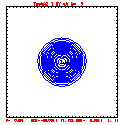
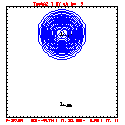
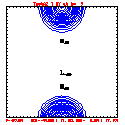
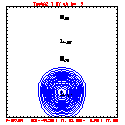
- Bubble placed at center at time T=0; V = 20 m/s
(constant); U=0, W=0
- Bubble moves 16000m from Y center [ 8250 m = ∆y/2 +
(ny-1)/2•∆y ] to +Y domain edge [ 16250 m = ∆y/2 +
(ny-1)•∆y ], out the periodic boundary at +Y top and
re-emerging from periodic boundary at -Y bottom,
returning to approximately the starting position (with
slight lagging phase error)
- At 20 meters per second, the bubble moves 8000m from center to top Y edge in 400s, and from bottom periodic boundary edge to nearly the domain center in another 400s. Run code for 800s, plotting every 200s
- All plots made with plotp6 program; theta contour plots
below use contour interval of 1˚
- 3-D plots use plotp6 default "eye", looking toward
origin from location in +X, +Y, +Z (so +X is out of
page towards you)
- Text output from running code may be found here. Animation of 3D view available as an animated GIF.
| Test A2 | T=0 | T=200 | T=400 | T=600 | T=800 |
|---|---|---|---|---|---|
| Y-Z i=17 |
 |
 |
 |
 |
 |
| X-Y k=9 |
 |
 |
 |
 |
 |
| 3-D |
 |
 |
 |
 |
 |
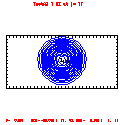
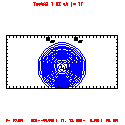
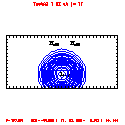
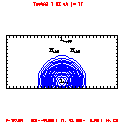
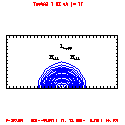
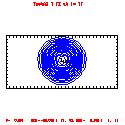
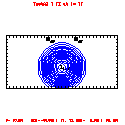
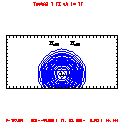
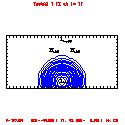
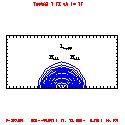
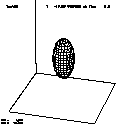
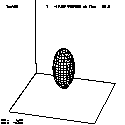
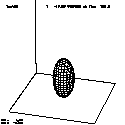
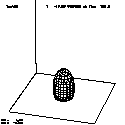
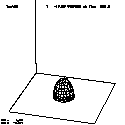
Test A3: z-advection of theta
- Bubble placed at center at time T=0; w = -20 m/s
(constant); U=0, V=0
- Bubble moves 4000m from near Z center [ 4250 m = ∆z/2 + nz/2•∆z ] to -Z bottom edge [ z = 250m = ∆z/2 ]
- This test requires "defeating"
your W BCs by e.g. re-setting W=-20 everywhere after
your call to your BC routine ...
... to "override" where your BC routine sets W values on the top and bottom boundaries to zero as it should. - At 20 meters per second, the bubble moves 4000m from center to bottom in 200s. Run code for 200s, plotting every 50s
- All plots made with plotp6 program; theta contour plots
below use contour interval of 1˚
- 3-D plots use plotp6 default "eye", looking toward
origin from location in +X, +Y, +Z (so +X is out of
page towards you)
- Text output from running code may be found here. Animation of 3D view available as an animated GIF.
| Test A3 | T=0 | T=50 | T=100 | T=150 | T=200 |
|---|---|---|---|---|---|
| X-Z j=17 |
 |
 |
 |
 |
 |
| Y-Z i=17 |
 |
 |
 |
 |
 |
| 3-D |
 |
 |
 |
 |
 |
Other advection tests
I don't currently have other advection tests on here. There are several ways you could test advection of U, V, or W. To test advection of U, for example (udu/dx + vdu/dy + wdu/dz), you could use the same formula you currently use for theta and use it to create a 'bubble' in U; then force V and/or W to be constant on every time step, and see if it moves the U "bubble" correctly. Another possibility is to set V=W=0, let U vary as sin(x), for example, and let it evolve; du/dt = -u*du/dx is a nonlinear problem that we investigated in computer program #1.If you are having difficulty with your advection (of momentum, or theta), let me know - we can probably construct one of the above tests to check your code, if you can't find an obvious problem.