| |
Hands-On, Minds-On Meteorology
Description
| Programming | Operation
| Thunderstorms
Description
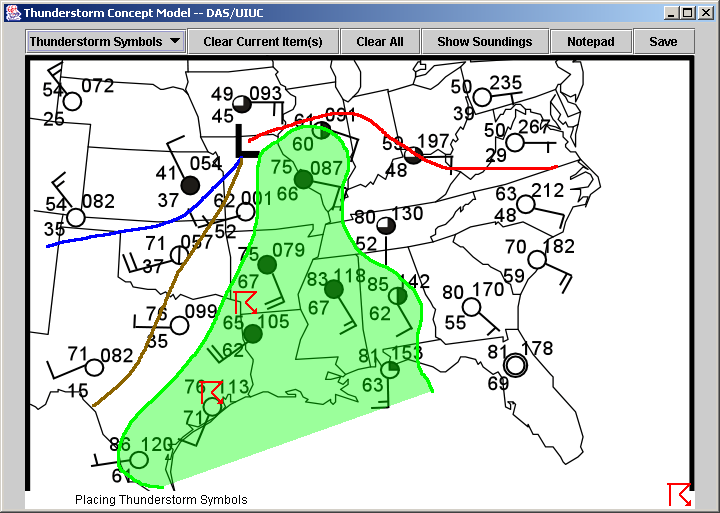
The Thunderstorms program allows the user to look at a surface observation
map and annotate features relevant to thunderstorm activity. These features
include: region of high dew point temperatures, warm fronts, cold fronts,
dry lines, and thunderstorm symbols. It also allows the user to look
at strategically placed soundings in the region.
|
click for whole shot |
Objectives
The primary objective of the Thunderstorms program is to show how all
the above features work together to produce area of thunderstorm activity.
It also helps them map out how each feature relates to the other geographically
(high dew points ahead of dry line, dry line ahead of cold front, etc.).
Programming
Theory
There isn't much to the Theory, the drawing commands are similar
to that found in Contour, with the exception that the high dew point
temperature region is a filled polyLine with a transparent middle.
Since in Java, a polyLine's first and last point must be the same,
and that doesn't have to be the case in normal drawing, I simply add
an extra x-y pair to the vector once the drawing is done. To avoid
program failures, the filled portion of the area remains off until
drawing has ceased.
The soundings window is a simple variant of SlideViewer.
Assumptions
Applicable Assumptions
Equations
Applicable Equations
Other
Any other information
Operation
Running the Program
- Click the Thunderstorm button.
- Change the desired annotation item by choosing it from the pulldown
menu.
- To place thunderstorm symbols, select Thunderstorm symbols from
the pulldown menu. An unending supply will appear at the bottom
right of the map. Use the mouse to click and drag the symbol to
the desired location. A new symbol will appear when you let go
of the mouse.
- You can move already-placed thunderstorm symbols
- Clicking Clear Current Item(s) will erase all thunderstorm symbols,
all cold front lines, etc. for whatever item is currently listed
in the pulldown menu.
- Clicking Clear All erases absolutely everything
- Clicking Show soundings brings a new slideviewer-style window
with a sounding. A blue dot will appear on the map correlating
with the sounding's location.
- Change sounding images by choosing a new city from the pulldown
menu in the sounding window.
- The map with annotations can by saved by clicking the Save button.
Extra Knowledge
None as of yet.
 |
Department of Atmospheric Sciences
University of Illinois at Urbana Champaign
Created by Dan Bramer: Last Modified 07/27/2004
send questions/comments to bramer@atmos.uiuc.edu
|
|