| |
Hands-On, Minds-On Meteorology
Description
| Programming | Operation
| RadSat
Description
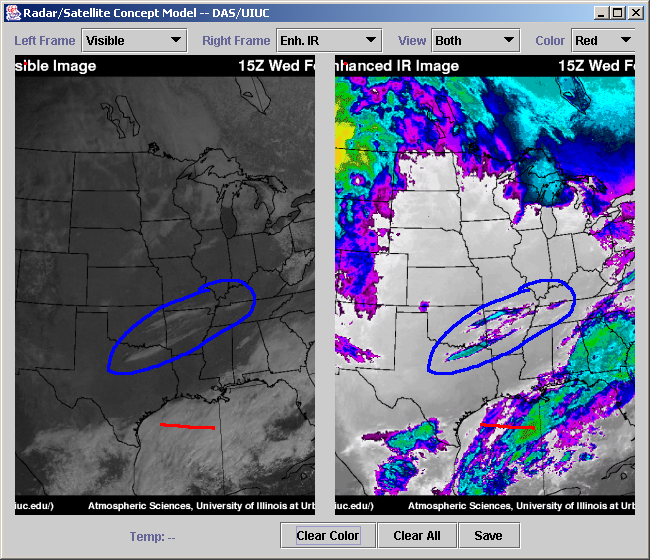
The RadSat application is a two-panel satellite / radar image viewer
with annotation capability.
|
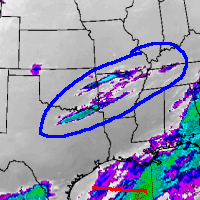
click for whole shot |
Objectives
The primary objective of the RadSat application is to allow students
to take a general product (such as satellite images) and view/compare/annotate
variations of that product (IR, visible, etc.) to learn the nuances
and differences between them.
Programming
Theory
Nothing new from the Contouring application, but an extra piece of
code to retrieve IR colors for temperature, and a right click drag
to pan the image around. The 2-panel view can isolate each panel into
a full-screen and back.
Assumptions
IR Temperature retrieval works on the image, not the data. This
means that the black found in state/country boundaries will be interpreted
is as abnormally warm. Also, there is a potential that the program
that generates the satellite images may slightly alter the colors,
causing up to about a 3-5 degree error.
Equations
1) IR Temp retrieval
The IR satellite's color-to-temperature relationship is represented
by two linear functions:
One for a brightness value of 176 and less, and one for more than
176.
If the brightness value > 176, the temperature in Celsius = 418 -
the brightness value.
Otherwise, the temperature in Celsius = 330 - (the brightness value
/ 2)
Other
N/A
Operation
Running the Program
- Click the button labeled 'RadSat'.
- Change slides by changing the appropriate pulldown menu.
- Save current side + annotations by clicking save.
- Changing slides will not result in the loss of annotations..
Extra Knowledge
Note Assumptions above
 |
Department of Atmospheric Sciences
University of Illinois at Urbana Champaign
Created by Dan Bramer: Last Modified 07/27/2004
send questions/comments to bramer@atmos.uiuc.edu
|
|