Hands-On, Minds-On Meteorology
Description | Programming | Operation

Growing Seasons

Description

The Growing Seasons program is an interactive look at how climate affects crop planting. Users choose a crop to plant (from a provided list) and a location to plant it (also from a provided list). They then watch their crop grow through the season, hoping to avoid an early or late-season frost, insects or heat-waves.


click for whole shot


Objectives

The primary objective of the Growing Seasons application is to gain an understanding of the effects of weather and climate on agriculture. Students should also gain a working knowledge of growing degree-days.


Programming

Theory

Users first pass though a splash screen that explains what the growing seasons experiment is.

The user then selects a city form a list (Champaign, Illinois; Oklahoma City, Oklahoma; and Billings, Montana) and a crop (corn, cotton, or sunflower). Upon choosing continue, they see a climate data histogram. At the top left of the histogram is a button that explains the histogram itself, so no extra information will be provided here. Users can still change their crop and city selections during this process.

Users then slide the plant date bar and use the frost information histograms to pick a plant date. The plant date is selected by using the 'Plant Date' scrollbar.

After pressing the "OK, I'm ready to plant" button, a verification window will appear, showing all entered information. Users will have the ability to return to the previous window(s) to change their information or to continue. At this point the program randomly selects one year from historical data (ranges 1902-2001 for Champaign, 1952-2001 for Oklahoma City and Billings) to use as the growing season (more below).

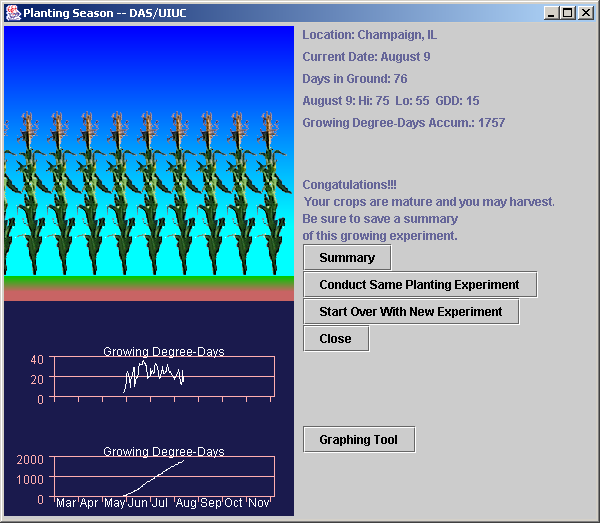
Upon continuing, the main frame appears. All pertinent information is placed on the right side, and the growing graphic is on the left. By clicking the begin tool, the days advance, one-by-one, until the end of the month. At the end of the month, the program will stop so the user can see the current data. If their crop is not yet mature, they click the 'get data for next month' button and the next month is run, and so on. When the crop either is mature or killed, the students can view all the data through the graphing tool or save a graphical summary of the experiment. They can then plant the same crop on the same initial date with a different year's data, start the process completely over, or end the program.

Each growing experiment uses a random year of actual data. The year of data used is displayed as a coded value ONLY FOUND ON THE SAVED SUMMARY IMAGES. The Year is decoded by adding 1901 to the number. For example, 2 = 1903; 72 = 1973; and 99 = 2000. This applies for each city, regardless of the first year of their respective data sets.


Each city in the program has data kept in a separate file, and the main program accesses the right data by if statements.

Assumptions

  • No rain information is available, so flood damage is not a possibility
  • 10 consecutive days of 90°F highs determines heat wave for all crops except cotton (100°F for cotton)
  • A low temperature of 29°F is enough to kill a crop from frost regardless of what stage it is in.
  • The chance that bugs destroy a crop is calculated by generating a random number every 5 days. If that number is greater than 0.9999, then the bugs have their way. This amounts to a 1 in 10,000 chance every 5 days that this will happen. In a 150 day growing season, this check is made 30 times, meaning the chances are roughly 3 out of every 1000, or 0.3% chance that this will happen.
  • The random number generated either for bug infestation or selecting the data years are truly random.
  • The plant's size in the main window is a linear percentage of the growing degree days required for maturity for that crop.

Equations

Growing degree days are simply calculated by subtracting the mean temperature for the day ((max - min) / 2) from the base temperature as defined by the crop itself (Information found at the time one selects their crops). If the resultant number is negative, the the number of growing degree days for that day is 0. For corn, if the mean temperature is greater than 86, 86 is used as the mean temperature. The following table illustrates the Base Temperatures and Growing Degree-Days required for each crop.

Crop
Base Temperature (F)
Growing Degree-Days
Corn
50
1750
Sunflower
45
3409
Cotton
60
2150


Other

Any other information


Operation

Running the Program

  • Click the link for Growing Seasons.
  • Choose the city by clicking the appropriate radio button
  • Choose the crop by clicking the appropriate radio button
  • Choose the plant date by sliding the slider labeled 'plant date' in the 'Number of Growing Degree-Days' window.
  • View historical frost information by clicking the appropriate button in the 'Number of Growing Degree-Days' window.
  • Click the 'OK, I'm ready to plant' button then the 'yes' button that follows to begin the growing season.
  • Click the 'begin' button to start the season.
  • Click the 'Get Data for Next Month' button to continue the growing season to the next month.
  • Click the 'Graphing Tool' button to view/graph/export the data collected.
  • When finished, click the 'Summary' button to create an image of that season to save.
  • When finished, click the 'Conduct Same Planting Experiment' button to use the same crop, location, plant date, and a new random year's data.
  • When finished, click the 'Start Over with New Experiment' button to restart the experiment and choose all new information.
  • When finished, click the 'Close' button to end the program.

Extra Knowledge

Champaign data was provided by the Illinois State Water Survey.
Oklahoma City and Billings data was provided by NCEP.


Department of Atmospheric Sciences
University of Illinois at Urbana Champaign

Created by Dan Bramer: Last Modified 07/27/2004
send questions/comments to bramer@atmos.uiuc.edu